An analytic look at the New York Rangers
Bobby Bevilacqua
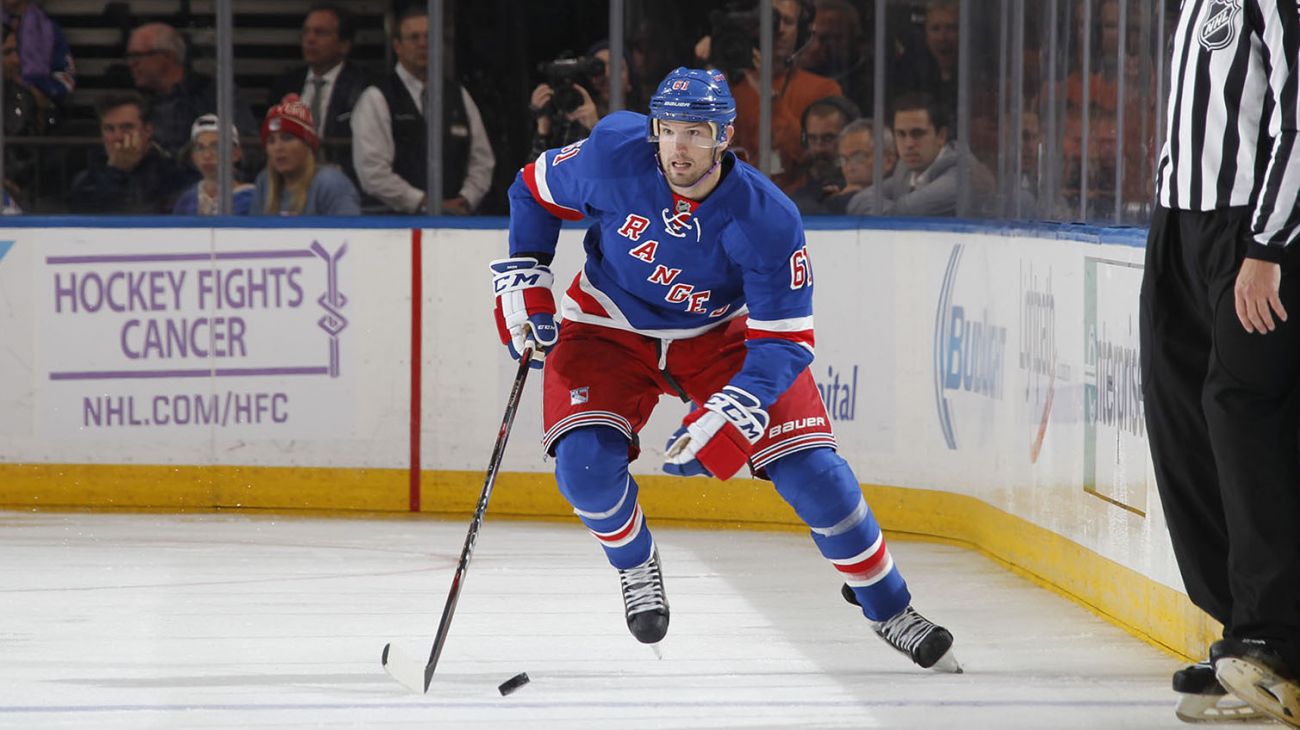
Rick Nash has been criticized this year, but he’s doing everything right. Photo courtesy of MSG Photos.
“The eyes can deceive you, don’t trust them.”
Obi-Wan Kenobi’s advice to the young Luke Skywalker holds value in many walks of life, but it fits perfectly when it comes to the sport of hockey. Every year, more sports and more people are starting to turn to sabermetrics and analytics to get a deeper understanding of their team or sport.
Analytics is slowly starting to catch on in hockey. It can be confusing at first, but it really helps get a look at possession, creating offensive possession, and even things like “puck luck.” You can also predict regression from players and team, and more effectively evaluate a player’s performance.
Rick Nash receives the most criticism out of all of the Rangers skaters. A 42 goal scorer last season, the $7.8 million man is yet to put a puck past a goalie, scoring into the empty net for his only goal of the year. But analytics show that Nash has actually been one of the best forwards on the team.
Nash has always been a positive possession player, and that trend has continued this year. Nash’s corsi rating, a stat that uses shot attempts to measure possession, is at almost 54% in all situations (even strength, power play, shorthanded) through the first 12 games. When a player’s corsi is over 50 percent, it means that their team is controlling the puck more and getting more shot attempts.
So when Nash is on the ice, the Rangers generally have more possession and scoring chances. This is evident when watching the game too. Rick Nash, along with his linemates Derick Brassard and Mats Zuccarello, are regularly in the opponent’s zone, controlling the puck and getting more shot attempts than whoever they’re playing.
That translates into the other stats as well. Zuccarello leads the team with seven goals, Derick Brassard leads the team with 10 points (4 G, 6 A), and Rick Nash has five assists. Puck possession and more shots lead to goals and production.
Also, Nash’s career shooting percentage is 12.4. This year, his shooting percentage is a 3.0. That number is due to balance out over time and trend up towards the norm. If he was shooting at his career 12.4 percent, he’d have four goals and nine points in 12 games, far from struggling.
Nash has been doing everything right, but he hasn’t been getting the bounces that Lindberg or Brassard have gotten so far. As long as he keeps playing the way he is, the goals will come. AV isn’t worried about Nash, and you shouldn’t be either.
Oscar Lindberg is second on the Rangers in goals (6), and third in points (9) in his rookie season. JT Miller has had a solid start to the year with six points (1-5-6) in all 12 games. But these are players that could see regression.
Neither Lindberg nor Miller really drive possession all that much. Lindberg’s hovering at a respectable 71 percent corsi for, while Miller is all the way down in the low 40s. They have been producing, but their on ice shooting percentage is through the roof, something that usually isn’t sustainable. Lindberg’s shooting percentage is 28.60, which he won’t sustain over an entire season.
On defense, the two brightest stars have been Keith Yandle and Kevin Klein. Klein has been so, so good to start the season. Despite starting almost 60 percent of his shifts in the defensive zone, he’s managed a corsi of 52.46 percent, driving possession while also scoring three goals and playing responsibly in his own end.
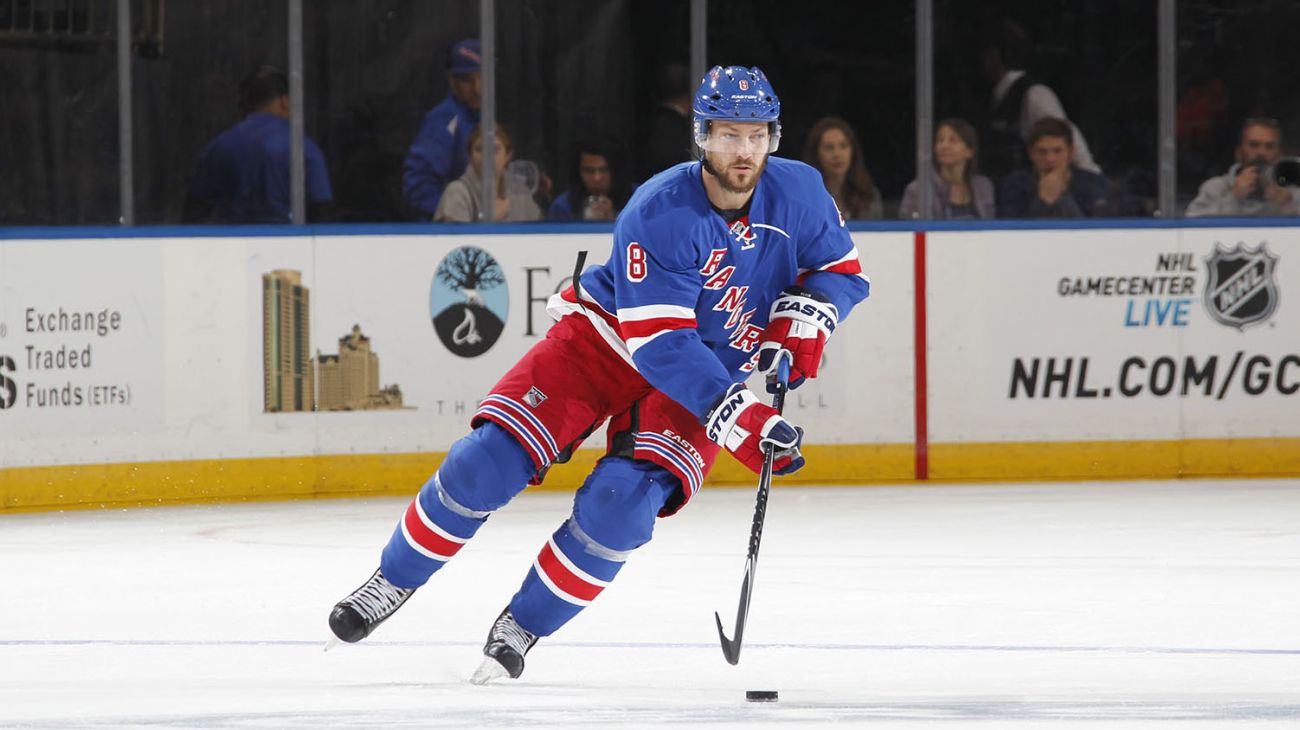
Photo courtesy of MSG Photos.
Keith Yandle is the only Ranger forward with a higher corsi at even strength, sitting above his career average with a 52.60 percent. He leads all Rangers with a +14 high-danger scoring chance differential, while only Kevin Hayes is in double digits in that category. In just scoring chances, Yandle is a +22, second to Kevin Klein (+28) and way ahead of Rick Nash in third (+13).
So basically, Yandle is an offensive defenseman that drives puck possession and plays a crucial role in the Rangers offensive capabilities. He may have a few turnovers here and there, but it’s not to the point where it costs the Rangers games.
On the other hand, some will point to Dan Girardi and Marc Staal as steady, defensive defensemen. Analytics says otherwise. Girardi’s corsi is at an abysmal 40.17 percent, while Staal is not much better with a 42.32 percent. Girardi also has the worst scoring chance differential and shot differential, with a -21 and a -54 rating.
This doesn’t mean that I don’t think that either of them can be effective. I do think that shot blocking still has a place in this league, and both Girardi and Staal have shown that they can shut down top players in the past. But neither of them have played up to their potential, and they continue to miss assignments and get caught out of position, particularly Girardi. They both need to be better, and the stats show that.
While some of this can be attributed to starting the majority of shifts in the defensive zone, Kevin Klein handles that same burden and still manages to be positive in possession.
Analytics are like a fine wine. It can be good on its own, but it’s most effective when complementing a meal. Use the advanced statistics to help back up what you already see on the ice.
Posted on November 5, 2015, in In the Crease and tagged Alain Vigneault, analytics, corsi, Dan Girardi, Derick Brassard, fenwick, Hockey, JT Miller, Keith Yandle, Kevin Klein, Marc Staal, Mats Zuccarello, Nash corsi, New York Rangers, New York Rangers blog, NYR, Oscar Lindberg, Rangers, Rangers blog, Rangers corsi, Rick Nash. Bookmark the permalink. Leave a comment.

Leave a comment
Comments 0